
Introduction
In today’s data driven world, ML algorithms are at work at all times, when we go about our daily lives. Whenever we make a CC transaction there is a ML algorithm that looks at it see if it is a legitimate transaction or a fraudulent one, when you are browsing for a book or a product at an e-commerce platform, it comes up with recommendations on what you might like, your healthcare service provider is probably using ML to screen the radiology images to see if a growth is benign or not. Facial recognition, driverless cars and the list of applications that use ML are ever expanding.
ML vs Programmatic approach to problem solving
Before we delve into what ML algorithms are, how they work, there is a more fundamental question that must be answered. Why do we need to make the machines learn? Why can’t we code up the steps involved in solving the problem and make the computer do we what we want them to do? After all, that is a way we have been using the computers thus far. The field of Computer Sciences is all about solving problems. So long us we choose the right data structure and the steps in involved in solving the problem, no problem is too difficult to solve. Isn’t it? Then why all this fuss about making the machines to learn from data. And moreover, the ML problems are data hungry. We need humongous amount of data to train the ML models? But why? Why waste computing resources, collect so much of data so that the machines can learn to predict from the data? Isn’t there a simpler way? Isn’t there a way to solve the same problem programmatically? We will try and answer those questions through an example.
Computer recognition of hand-written digits
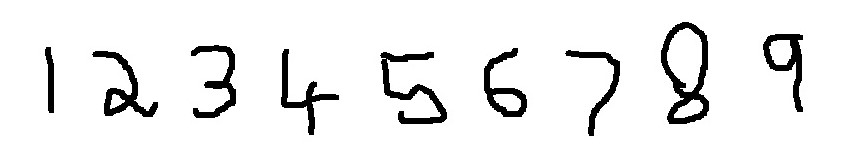
To understand why ML is the way to solve a problem for certain application, let us consider a simple example. Say, you want the computer to recognise handwritten digits.
In a more general term, we can describe the steps involved solving any problem in the following steps:
- We have a certain input data.
- We are looking for a certain outcome or output.
- We have a rough idea of the steps in involved in getting to the desired output from the given input.
- We then write the detailed steps involved and get the computer to solve it for us.
In the case of recognition of the handwritten digits, one approach is to figure out the underlying pattern of these digits. For example, the digit 1 comprises of one straight line and 4 has three straight lines arranged vertically and horizontally, 8 has two circles and so on so forth. Can we therefore develop our programme to recognise these patterns and therefore the underlying numbers? But the problem is that the handwritten digits vary widely between individuals. And writing a program to decode all the patterns is nearly impossible. And this approach has been tried and it is very error prone, meaning the number of times the program is able to correctly decode the handwritten digits is very low.
What then is the solution?
Instead of us trying to figure out the intricate patterns and updating the program whenever a new data / pattern comes along, why not let the machine learn the pattern from the data and come with a way to recognise the digits? We will outline below a method to solve this problem through machine learning.
Essential steps to solving a problem through ML
The general approach to solving a problem through ML comprises of the following steps:
- Data preparation
- Split the data into Training set and Test Set
- Choose a model for learning from the training set.
- Validate the model’s efficacy through test set.
- If the model performs well on the test set, then go live. Else, iterate through steps 3 to 5.
Data Preparation for recognition of digits
As a first step to developing a solution for recognition of the digits, we need to translate the digits into a machine-readable format. Just uploading the handwritten digits as an image, for example won’t work. We have to break up the images into small pixels and each pixel must carry the information on the colour of the pixel. Let us consider a pixel frame of 28 x 28 = 784 pixels. The colour of each pixel is represented by an 8-bit number. Each pixel value denotes the colour in greyscale. Zero means black and 255 denote white. Each digit is an array of 784 numbers with each number holding the information on which pixel is black or white or a shade of grey.
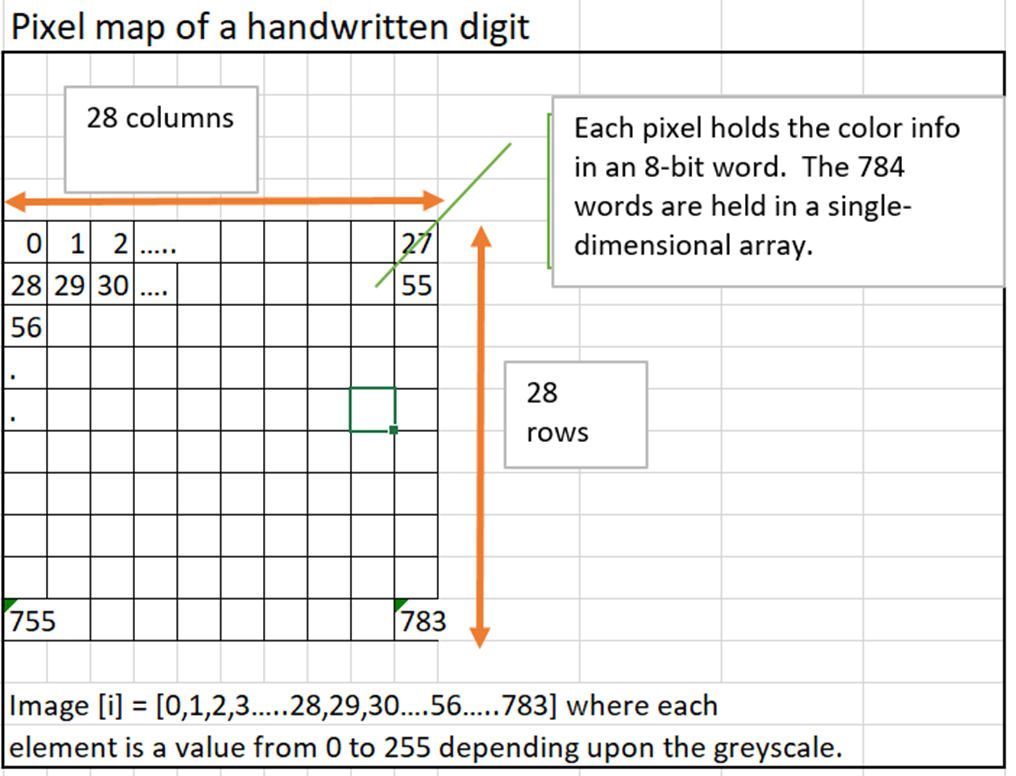
We now have the handwritten digits in the form of an array of 784 (bytes) numbers. We also need to let the machine know what digit each pixel map corresponds to. Each pixel-encoded image map has been assigned a assigned a label by a human. We will set this up in a table – where each row contains a labelled digit and its pixel-encoded image map. So, let us say we create a table of 60,000 handwritten numbers in the pixel format and their corresponding labels (digits), we then have a way of training the ML model. We need not create this table ourselves. There is a ready database available from MNIST. The MNIST database (Modified National Institute of Standards and Technology database) is a large collection of handwritten digits. It has a training set of 60,000 examples, and a test set of 10,000 examples. (Data in the Training set is used to learn the parameters of the model whereas the test set data is used to measure the efficacy of the model.)
Model selection
The problem we are trying to solve here, is a multi-level classification problem. From the given input, we need to predict what number / digit that it is most likely to be.
Now let us say, we are given a handwritten digit and we have to pick a number from 0-9 that it represents. We have to compare the pixel map of the input digit with each and every entry in our training set and figure out to what entry that it is closest to. There are several algorithms to figure out how we compute the closeness of the given image with the image map of the numbers in the training set. The simplest being Euclidian distance. For example, if you plot two points (x1, y1) and (x2,y2), in a two-dimensional (x,y) plane, distance is simply the square-root of the two sides of the triangle. Similarly, we can use Euclidian distance as a measure of how similar two pixel images are or how dissimilar they are to each other.
We have to compare the bit-map of the given input digit with all the pixels in the training set. Pixel by pixel, we will measure the square of the differences between the given number and the zeroth entry in the training set over all the 784 pixels of the two numbers. We then repeat the exercise for the 60,000 entries in the training set. The one digit from the training set for which the square of the error is least, is the digit that the input digit is closest to. Once we arrive at an image map which is closest to the new image for which we have to make a prediction, we just pick the digit associated with that entry in the training set and that is the predicted digit.
Once we have picked a digit from the training set that is closes to the new image for which we have to make a prediction, we can say with reasonable confidence that the new image that has been presented to us corresponds to that number from the training set.
Measuring the Performance of the model with the test set data
Before we go live with model and use it to make predictions, we have to test its efficacy. That is where the role of test set comes in. The data in the test set is not present in the training set and model has not seen it before. We can therefore use the test set data to see how the model performs against it. For each and every prediction the model makes against the test set, we compute the error. Let us say the actual digit is 5 and the model says that it is 0, then the error is square of the difference. If the predicted value is correct, then there is zero error. For the test data, we can compute the squared error for all the predictions. We have to tweak the prediction algorithms such that we achieve the least error. For example, instead of basing our decision on the closest one number, we may look at closest 5 numbers and pick a number based on maximum number of occurrences out of 5. We can also use more sophisticated measures of distance measurement. Once the model performs well against the test set, we can then go live.
Summary
In this writeup, we have looked at a simple ML model to solve a multi-level classification problem where the output is a discrete variable. Where the prediction we have to make is a continuous variable, the class of problems are solved through regression. Sometimes, we have to predict the probability of occurrence of an event and not its value. All these problems also have one thing in common and in that, they are all supervised learning problems where the input data contains the labelled outcome for the features. The ML models learn the parameters of the model from the given outcomes and minimises the loss or error. In unsupervised learning, there is no output variable. What we try to do here is to see the common patterns and structures based on which we can group the data into clusters. That concludes our blog on Introduction to Machine Learning.
For comments and feedback, write to Madan Mohan Raj, athimoolam.madan@gmail.com, Partner, Centre for Executive Learning. https://execedonline.co.in/